


Businesses produce more data than ever before, with data becoming an extremely valuable commodity. As a business owner, you may face challenges obtaining useful information from the great amount of data you collect. Leveraging data analytics can be a great asset for your business. This article will explore business data analytics and how your business can benefit from it.
Businesses Create Data
When you operate a business, there are different types of data, including:
- records of sales;
- customer feedback;
- expenses; and
- employee performance.
When data grows, organisations find it challenging to analyse using traditional methods and must turn to business data analytics.
What is Business Data Analytics and How Can It Help Businesses?
Business data analytics involves analysing data, both big and small. By using technologies like artificial intelligence, it offers your business valuable insights and information. It finds patterns and trends in the data. This helps a business understand its past performance, be cost-effective and make better decisions in the future.
Businesses want to know lots of things, for instance:
- which products and services customers prefer;
- the types of customers they are attracting; and
- which marketing strategies are effective.
Data analytics can allow your business to find answers more precisely and handle more challenging questions. Furthermore, data analytics also lets your business move away from relying solely on managers’ instincts and experiences and instead make decisions backed by data. However, even though instincts and experience matter, data provides solid facts for businesses to trust.
Continue reading this article below the formCall 1300 544 755 for urgent assistance.
Otherwise, complete this form, and we will contact you within one business day.
Types of Data Analytics
There are many ways to study data. For our purposes, we will focus on four types of data analytics.
| Types of Analytics | Description |
| Descriptive | Analyses past data to draw simple conclusions. For example, you can seek to understand the number of sales your business has made each February in the past five years. It is the simplest level of data analytics because it merely describes the insights from the data. Businesses often start with descriptive analytics before moving to more complex data analytics. |
| Diagnostic | Diagnoses data to understand the underlying reasons for the data patterns. While descriptive analytics describes the data, diagnostic analytics analyses the data to understand the ‘why’. For example, it explains why sales were high or low in a particular period, as shown in descriptive analytics. |
| Predictive | Uses historical and current data to predict future outcomes. For example, based on data from the last three years, predictive analytics could help predict the number of sales a business is likely to make within a specific future period. This helps with resource allocation to meet anticipated demand. |
| Prescriptive | Uses advanced technology like artificial intelligence and machine learning to analyse the data in real time. It predicts outcomes and recommends preferred courses of action for businesses in various areas. Prescriptive analytics represents the most complex type of data analytics and often requires significant investment. |
How Does Business Data Analytics Work?
Different projects have different ways of doing business data analytics. However, to keep it simple, we can split the data analytics process into four stages.
| Process | Description |
| Data mining | The first stage involves mining relevant data from various sources within or outside the organisation to answer the business’ questions. The relevant data are often unstructured data existing in different formats from sources such as: • physical documents; • the business’ customer relationship management software; and • customer feedback on the business website, among others. Data mining is often the most time-consuming stage of data analytics. |
| Data management and storage | In this stage, all mined data from the previous step is stored in a structured format that can easily be accessed by the data analysts for further analysis. |
| Data analysis | Here, data is analysed to identify trends and patterns within the dataset. Machine learning capabilities are often deployed during this stage to enhance analysis. |
| Data visualisation | After analysing data and understanding trends and patterns, you must present the results clearly to business decision-makers. You commonly show data using: • graphs; • charts; • dashboards; and • colourful PowerPoint. This helps decision-makers understand the data analytics outcomes. |
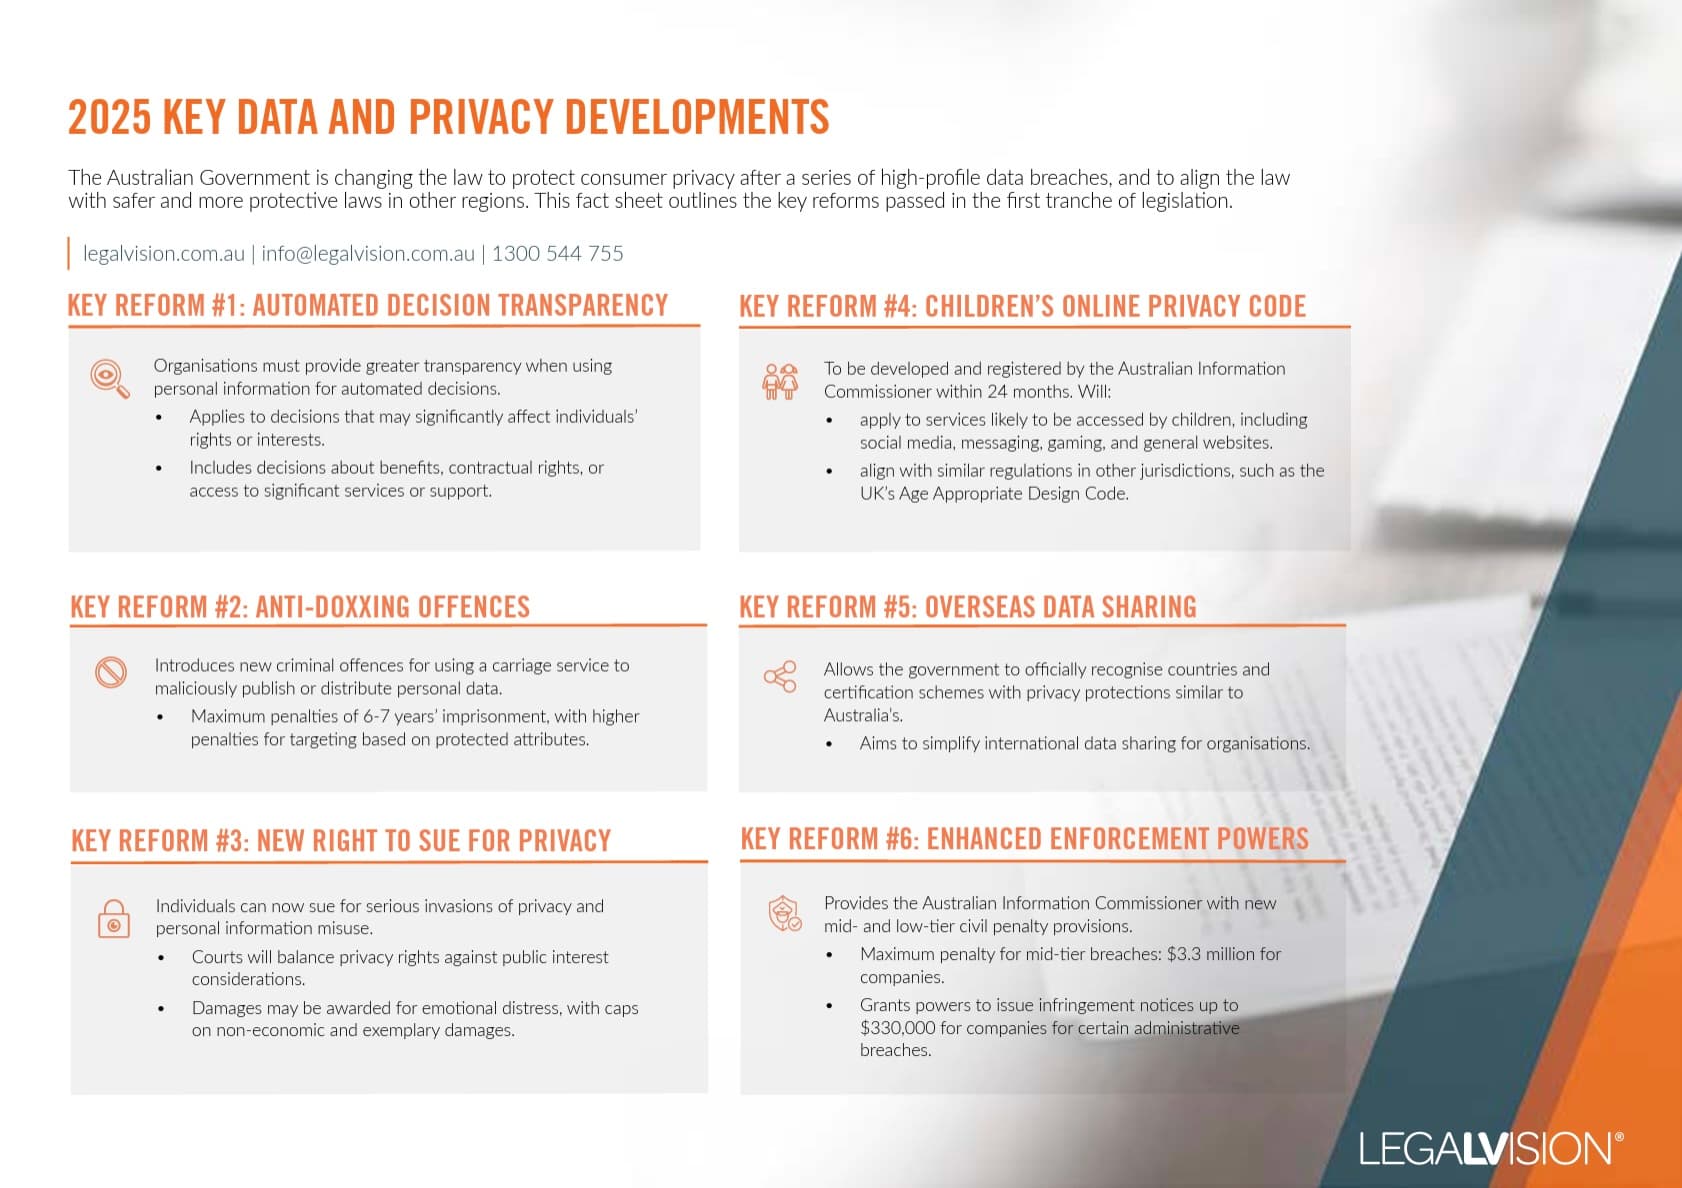
This factsheet outlines the Australian Government’s strengthened consumer privacy laws in 2025 following major data breaches and their alignment with global standards.
Key Takeaways
Businesses actively use data analytics, utilising advanced technologies like artificial intelligence to uncover valuable insights, going beyond instincts and past experiences. By studying past patterns and predicting future outcomes, companies make smarter decisions. They gather data, analyse it, and visualise results to make more precise choices. Embracing data analytics gives businesses a competitive edge and strategic success.
If you have any questions about business data analytics or how to use it in your business, our experienced legal transformation lawyers can assist as part of our LegalVision membership. For a low monthly fee, you will have unlimited access to lawyers to answer your questions and draft and review your documents. Call us today on 1300 544 755 or visit our membership page.
We appreciate your feedback – your submission has been successfully received.


